Data Visualization in Business Intelligence
by Darrell Beltran and Arvin Fernandez
Posted on 2020-09-01

Business Intelligence (BI) is a set of methods, processes, architectures, applications and technologies that gather and transform raw data into meaningful and useful information used to enable more effective insights generation and decision-making to drive business performance.
Data visualization has been rising rapidly for the past few years in the Business Intelligence and Analytics industry. It is also a big part of data science which has gained wide popularity recently.
Data visualization is the visual and interactive exploration and graphic representation of data of any size, type or origin. The purposes of visualizing data are multifold, ranging from general comprehension and understanding of ideas, supporting information behaviors to artistic expression and appreciation. Visualizing business data are focused on information seeking and decision-making behaviors. Visualization generally helps data comprehension and enhances problem-solving capabilities specifically the following:
• Visualization aids in the cognitive load of information processing.
• Data visualization provides a visual overview of complex data sets to identify patterns, structures, relationships and trends at a high level.
• Visualizations provide visual cues that draw people’s attention to quickly focus on areas of interest or areas of difference.
• Visualization exploits the human visual system and enhances intuition which extracts additional information and meaning.
Business Data Visualization
Business data visualization utilizes general visualization techniques that contains quantitative data, metrics or key performance indicators (KPIs) in a form of either charts, diagrams or dashboards to do data exploration analysis or make business decisions.
Information Visualization
Information visualization is also like data visualization that shares common features, principles and methods. However, information can be generally more qualitative and less structured. Information visualization utilizes free forms of visual diagrams or illustrations that are not specifically classified as quantitative data such as network graphs and workflow charts.
Business Data Visualization Forms
Most of the reports, dashboards or analysis presented are visualization-driven. They add interactive elements to enhance readability. There are basic categories of visual forms that are presented in their reports which are the following:
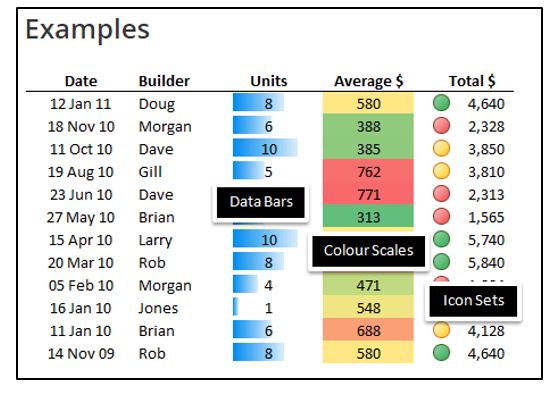
Embedded visual: Visuals are embedded in or directly on top of texts and other forms of data presentation. Embedded visuals include two major forms:
• Conditional Formatting: Refers to direct formatting or styling of text, numbers, shapes and other contents. It provides a decorative effect that reveals more meaning or highlights selected content from the data or text.
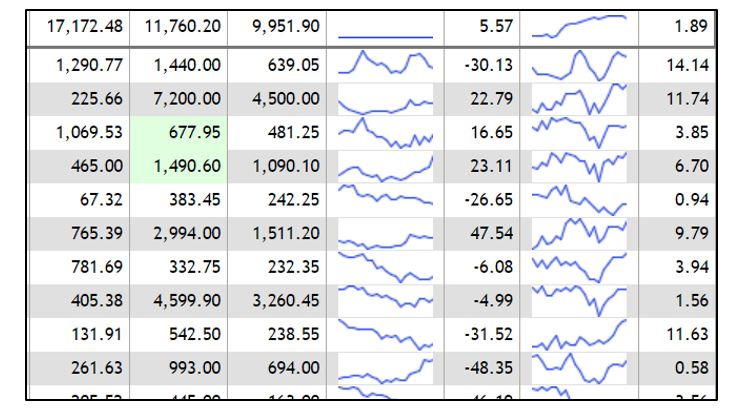
• Sparkline: A small minimized chart embedded in the context of text paragraphs, tables, images or other type of information. It presents the general data pattern in a simple and highly condensed way.
Block Visual: This visual unit occupies a larger space and is often a part of a report or dashboard. It can also be a standalone visual with many data points or complexity. A block visual could contain different forms:
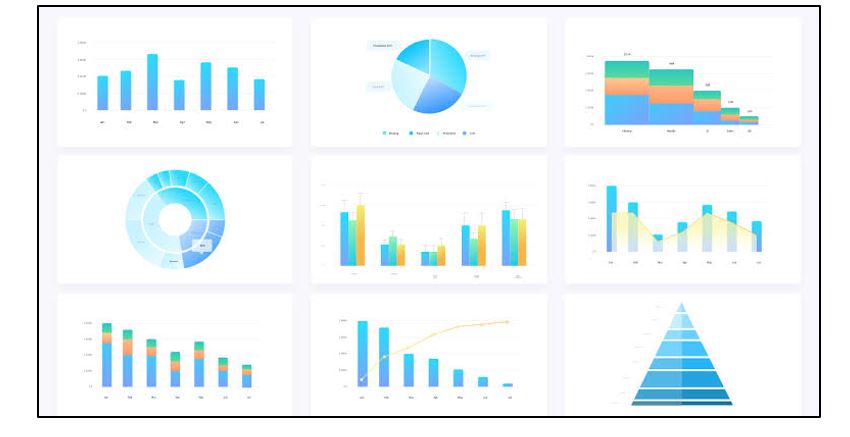
• Charts: A block visual occupies a larger space but still part of a report or dashboard, appearing together with other content. It is a more independent and self-contained visual unit. Charts are a visual combination of symbols (visual elements of point, line and area) and visual variables (color, shape, size etc.) which are directly associated with the data. Chart focuses on visualizing quantitative values such as business performance measures and indicators.
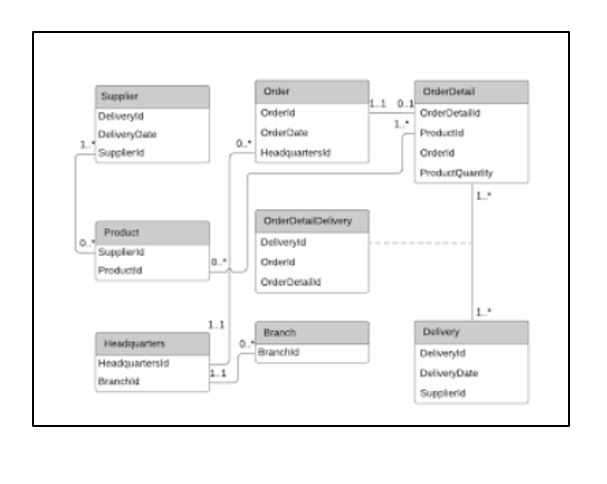
• Diagram: A diagram can visualize qualitative information to illustrate structures, relationships sequences etc.
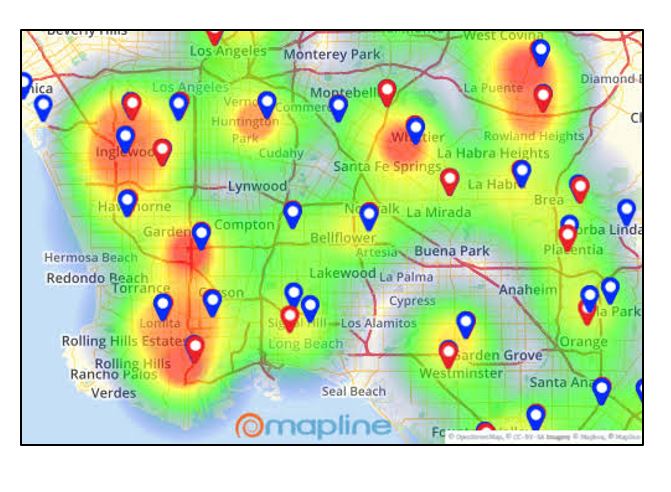
• Location-Based Visuals: This visualization contains location as a dimension in performing data analysis and decision-making. Many business activities are associated with locations. Location-based visuals are commonly based on a map, provide a background or a context that is familiar to the users and make the location-related data more comprehensible and perceivable.
Standalone visuals: It is a standalone application and is not mixed with other contents or tools. It could contain multiple types of visuals and can have interactions among them.
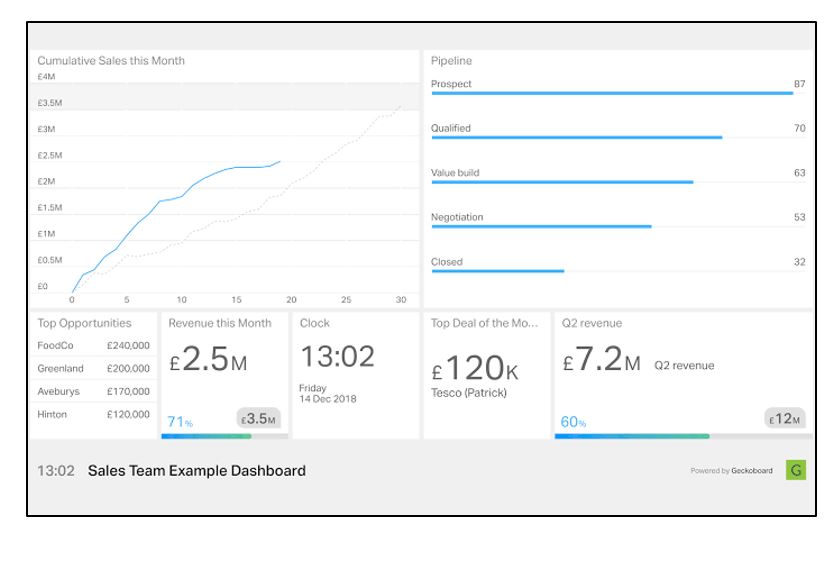
Dashboards: A stand alone visual that can be used as an application. They occupy a larger space or full screen. The data in the dashboards primarily consist of metrics, key performance indicators (KPIs) and textual information. A well-designed dashboard allows decision makers to see the most relevant data that reflect business status and support decisions. It is a highly summarized and centralized snapshot that saves a user’s time by eliminating the need to run multiple reports or get data from different sources. Dashboards have been expanded to 3 different types:
- Overview: Provides a high-level summary of business performance represented by KPIs. It specifically concerns the state of the overall business against strategic goals.
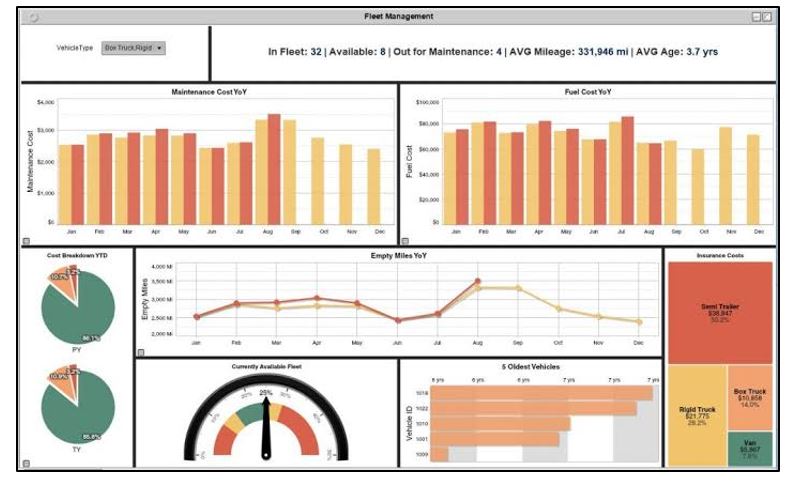
- Operational Dashboards: Display data that facilitate the operational side of a business, monitoring operational activities and statuses. They can be based on a real-time data.
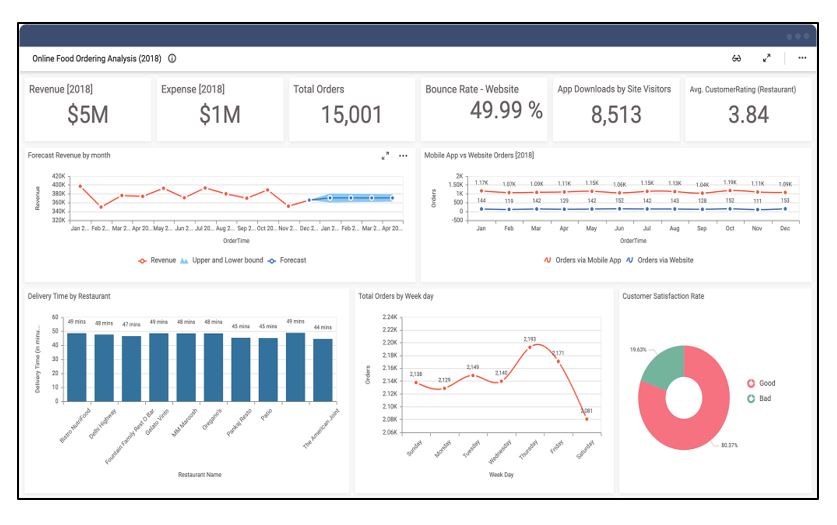
- Analytical Dashboards: Focus on interactive exploration or analysis of a large amount of data. They give the users the ability to investigate trends, predict outcomes and create insights.
Conclusion
The shifting focus on end users with better and more effective data presentation and visualization are increasing. Usage of business data visualization is now becoming an integral part of the business as it aids users and decision makers at different levels from different perspectives.
Recent Blogs